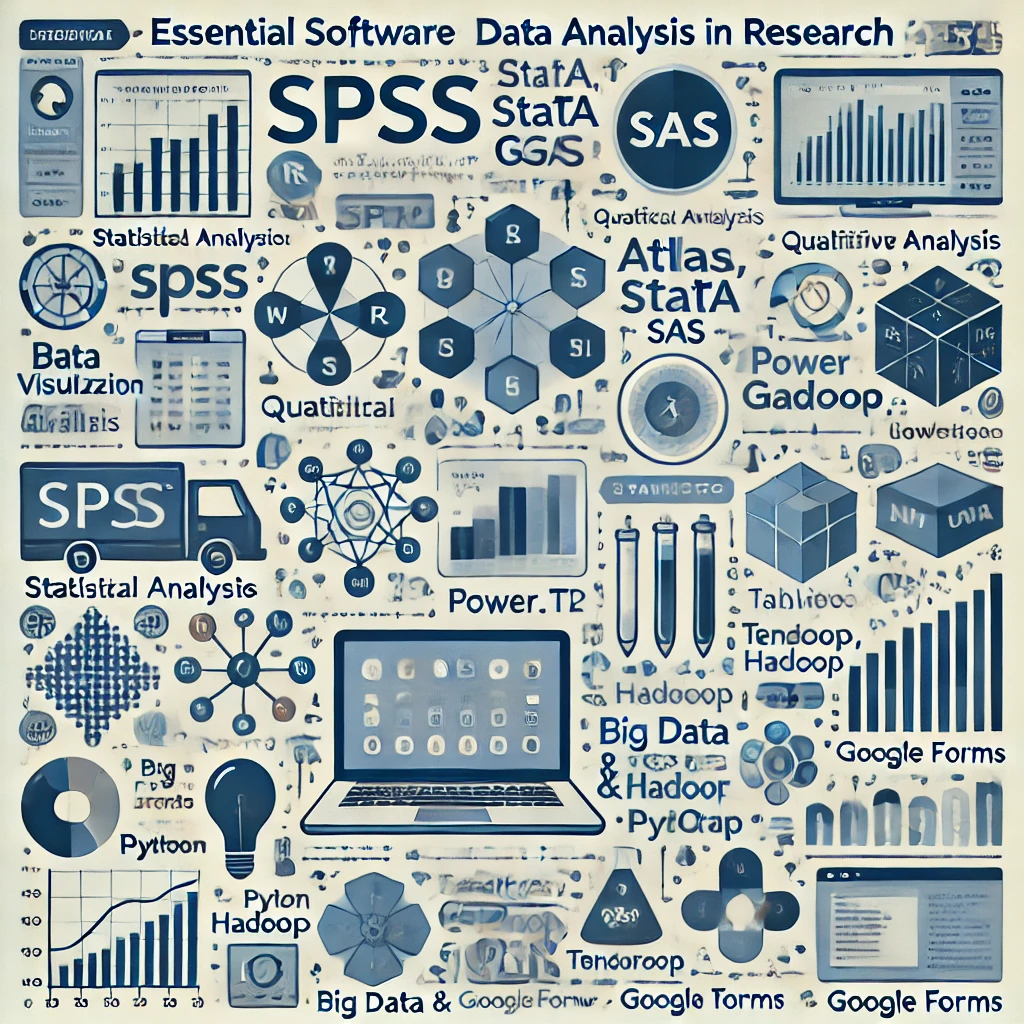
Data analysis is a critical component of research, enabling researchers to interpret results, identify patterns, and derive meaningful conclusions. Choosing the right software depends on the type of data (quantitative or qualitative), level of complexity, and specific research needs. Below is a list of essential software for data analysis, categorized based on their functionality.
1. Statistical Analysis Software
Statistical software is used for numerical data analysis, hypothesis testing, and predictive modeling.
SPSS (Statistical Package for the Social Sciences)
- User-friendly interface with point-and-click functionality.
- Suitable for descriptive statistics, regression analysis, and ANOVA.
- Widely used in social sciences, business, and medical research.
🔹 Best for: Beginners and applied researchers needing easy-to-use statistical tools.
R
- Open-source and highly extensible for statistical computing and graphics.
- Supports advanced statistical modeling, machine learning, and data visualization.
- Requires coding but has a large community and extensive packages.
🔹 Best for: Researchers needing advanced statistical analysis and visualization.
Stata
- Designed for econometrics, biostatistics, and social science research.
- Offers both a command-line interface and point-and-click features.
- Strong support for panel data analysis, time series, and survival analysis.
🔹 Best for: Researchers in economics, sociology, and medical fields.
SAS (Statistical Analysis System)
- Powerful for handling large datasets and complex statistical modeling.
- Used in business analytics, healthcare, and finance industries.
- Requires programming knowledge but provides automation options.
🔹 Best for: Large-scale data analysis in corporate and academic settings.
2. Data Visualization Tools
Visualization tools help researchers communicate complex data findings effectively.
Tableau
- Drag-and-drop interface for interactive visualizations.
- Integrates with databases and statistical software.
- Suitable for real-time data analysis and dashboards.
🔹 Best for: Business and social science researchers needing dynamic visual reports.
Power BI
- Developed by Microsoft for business intelligence and analytics.
- Strong integration with Excel, SQL databases, and cloud services.
- AI-powered data insights and real-time reporting.
🔹 Best for: Researchers working with business analytics and large datasets.
ggplot2 (R Library)
- Part of the tidyverse ecosystem in R for creating high-quality visualizations.
- Supports customization and complex multi-layered graphs.
🔹 Best for: Researchers who need detailed statistical graphics.
3. Qualitative Data Analysis Software
These tools are used for text analysis, thematic coding, and qualitative research.
NVivo
- Supports coding, text analysis, and multimedia data processing.
- Used in social sciences, health research, and education studies.
🔹 Best for: Researchers analyzing interviews, open-ended surveys, and focus groups.
ATLAS.ti
- Helps researchers organize and analyze qualitative and mixed-method data.
- Provides AI-assisted thematic coding and text mining.
🔹 Best for: Researchers conducting qualitative social science research.
MAXQDA
- Suitable for content analysis, interview coding, and mixed-methods research.
- Allows data import from various sources, including PDFs and social media.
🔹 Best for: Researchers conducting in-depth qualitative studies.
4. Big Data and Machine Learning Tools
For researchers dealing with large datasets, AI, and predictive modeling.
Python (with Pandas, NumPy, Scikit-learn)
- Open-source and widely used for statistical computing and machine learning.
- Libraries like Pandas for data manipulation, Scikit-learn for ML, and Matplotlib for visualization.
🔹 Best for: Researchers handling big data, AI, and automation.
Apache Hadoop
- Designed for big data storage and processing.
- Used in large-scale computing and distributed data analysis.
🔹 Best for: Researchers working with large-scale unstructured data.
TensorFlow & PyTorch
- Open-source deep learning frameworks for AI research.
- Used in image recognition, NLP, and neural network training.
🔹 Best for: Researchers in AI, computational neuroscience, and deep learning.
🔗 Website: TensorFlow
🔗 Website: PyTorch
5. Survey and Data Collection Tools
Collecting data efficiently is crucial for research accuracy.
Qualtrics
- Online survey tool with advanced analytics and AI-driven insights.
- Suitable for academic and market research.
🔹 Best for: Researchers conducting large-scale surveys.
Google Forms
- Free and simple survey tool with real-time responses.
🔹 Best for: Small research projects and quick data collection.
REDCap
- Designed for health and clinical research with secure data management.
🔹 Best for: Researchers handling sensitive medical data.
Choosing the Right Tool
When selecting data analysis software, consider:
✅ Ease of Use – User-friendly vs. coding-based tools.
✅ Data Type – Quantitative, qualitative, big data, or mixed methods.
✅ Integration – Compatibility with other research tools.
✅ Cost & Accessibility – Free vs. paid options, institutional access.
Would you like a comparison table or a guide on using specific software for your research needs? 😊

